Washington, D.C. is once again home to the country's best city park system, a new ranking finds.
Why it matters: City parks serve as community meeting spots and civic spaces, offer room for exercise and fresh air, and can draw in new residents — but they require investment, attention and protection.
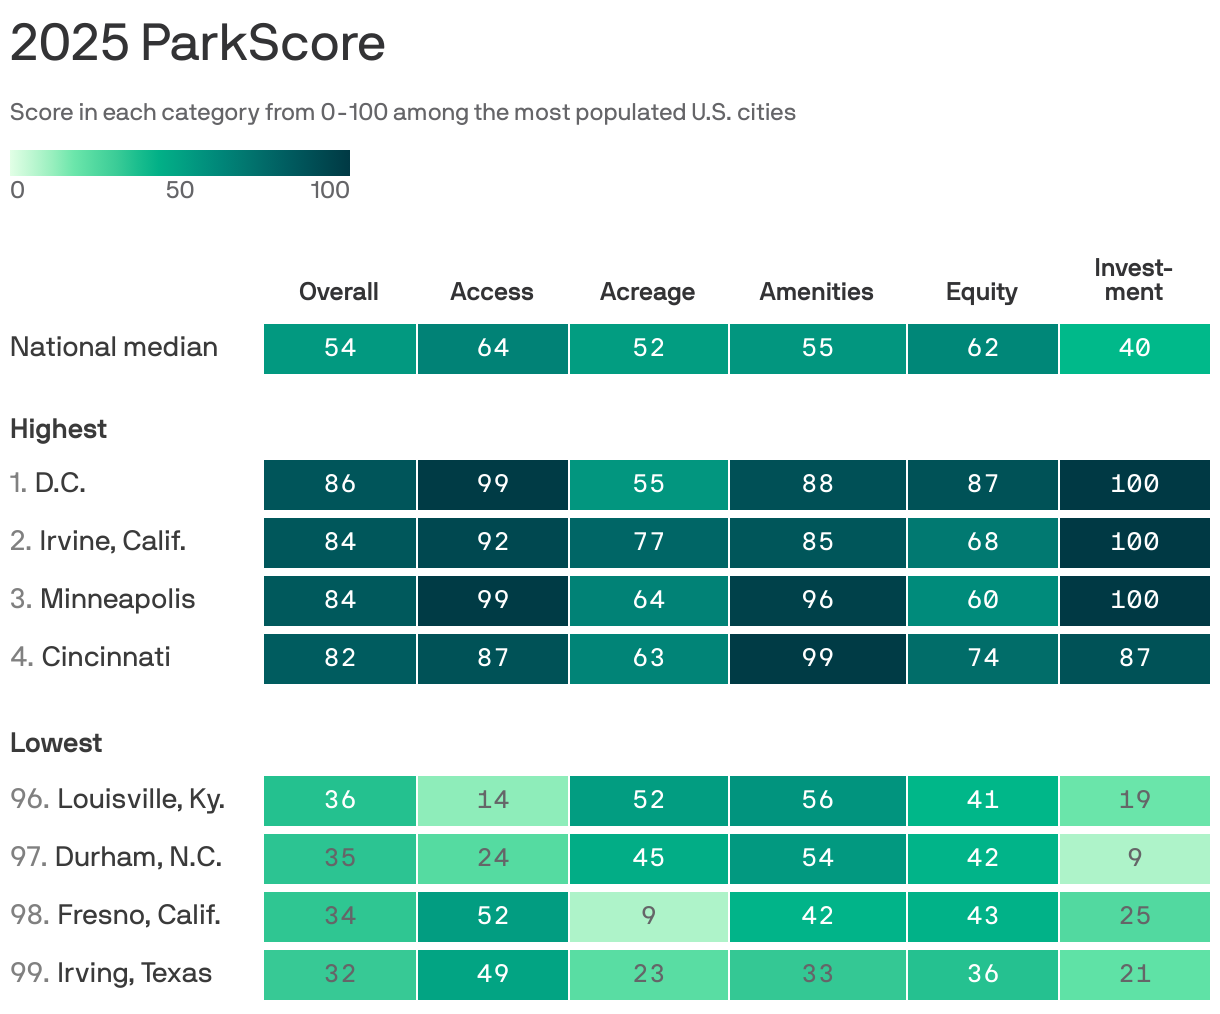
Driving the news: That's according to the 2025 ParkScore index, an annual ranking from the Trust for Public Land (TPL), a pro-park nonprofit.
The report ranks the 100 most populous U.S. cities' park systems relative to one another based on five categories: acreage, access, amenities, investment and equity.
What they found: D.C. took home top honors with a total of 85.5 points, thanks in part to big access and investment scores.
Irvine, California, came in second, while Minneapolis ranked third.
Zoom in: Irvine jumped from fourth place in 2024 to second this year — "propelled," TPL says, by "continued progress on its 'Great Park,' one of the most ambitious public park projects in the country."
Denver's now in the top 10 (up from 13th last year), while Cincinnati moved from eighth to fourth.
Stunning stats: Among the cities analyzed, $12.2 billion was invested in park and recreation systems in 2024, while 76% of residents now live within a 10-minute walk of a park.
Those are both records since TPL started tracking such figures in 2007 and 2012, respectively.
What's next: Some of the money cities are spending on public parks lately is tied to pandemic-era federal infrastructure funding, which won't last forever.
"It'll be interesting to see over the next couple of years, if there aren't replacement funds ... what that will mean for cities and communities that are really wanting to invest in parks," TPL president and CEO Carrie Besnette Hauser tells Axios.
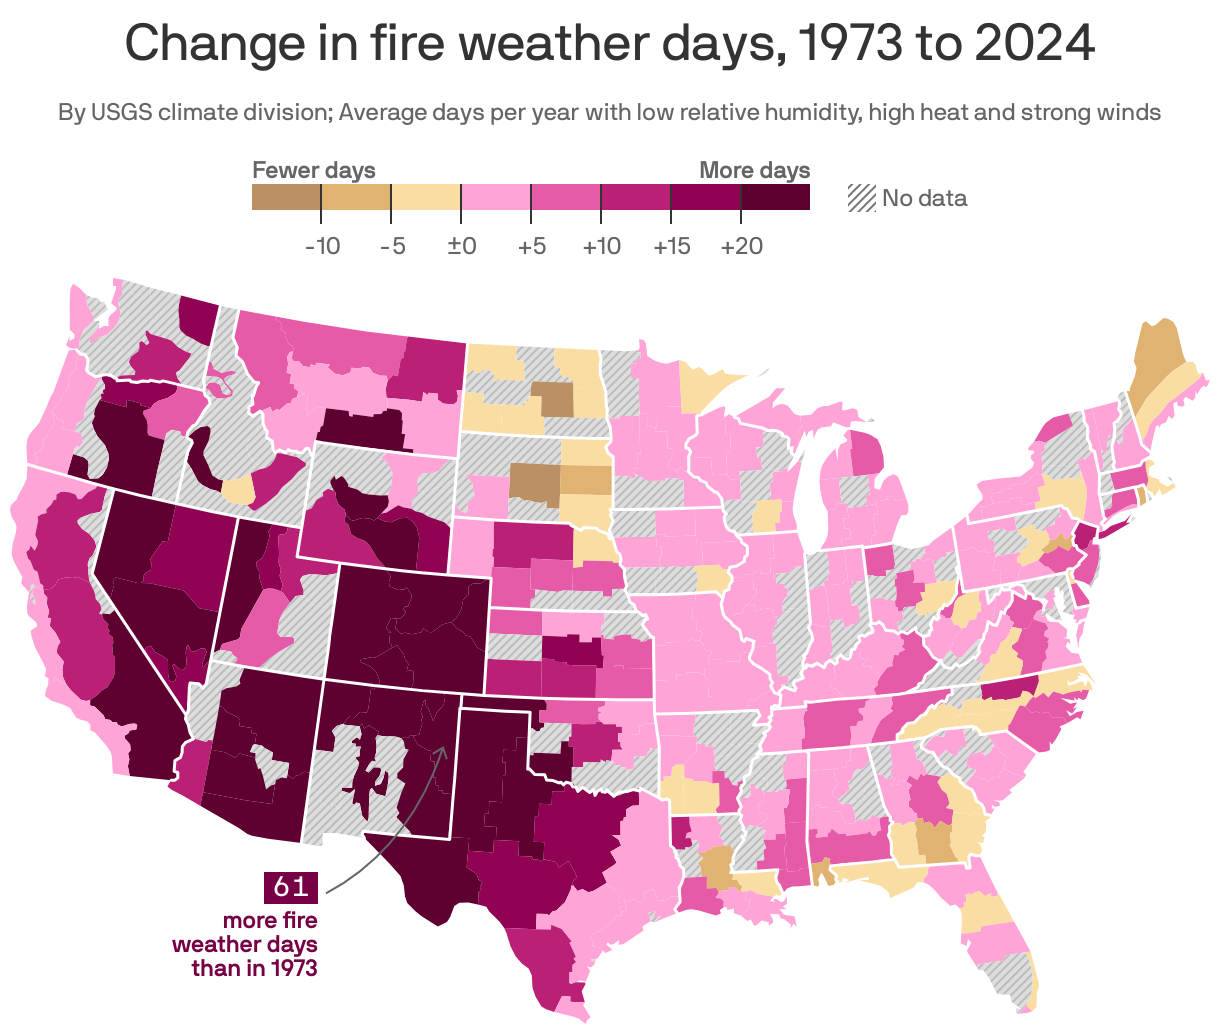
Hot, dry and windy weather that helps wildfires spread is becoming more common across much of the U.S. amid climate change, a new analysis finds.
Why it matters: What used to be several months of "fire season" is stretching in some places into a yearlong phenomenon, straining fire departments and others tasked with controlling or containing wild blazes.
Driving the news: The number of "fire weather" days rose by 37 in the Southwest and 21 in the West on average between 1973 and 2024, per an analysis from Climate Central, a climate research group.
Some areas, including parts of Texas, California and New Mexico, now experience "around two more months of fire weather per year compared to a half century ago," the group says.
Zoom in: Fire weather is also getting more frequent in some eastern and northeastern parts of the country, like New Jersey and New York's Long Island.
Yes, but: Fire weather days decreased in a handful of areas, such as central North Dakota (-12) and northern Maine (-8).
How it works: Climate Central's analysis is based on data from 476 nationwide weather stations and is broken down by 245 climate divisions across the continental U.S.
The group defined a "fire weather day" as one with temperatures of at least 45°-55°F (depending on the season), relative humidity within 5% of regional thresholds, and sustained wind speeds of 15mph or more — all happening together during at least two hourly measurements on a given day.
Stunning stat: Human activities (unattended campfires, sparks from power lines, etc.) start a whopping 87% of wildfires, Climate Central says, citing the National Interagency Fire Center.
Regardless of how a fire starts, "fire weather" can give them the push they need to spread and grow.
The big picture: Extreme wildfire events more than doubled in frequency and magnitude globally over the past two decades, a recent study found.
What's next: States like California and Idaho are preparing for what could be a challenging fire season as higher temperatures and faster winds risk turning even the smallest sparks into massive conflagrations.
If you're flying any time soon, you may be wise to avoid Newark Liberty International Airport.
Why it matters: Newark has been a mess lately — including major disruptions this week that left hundreds of flights delayed or canceled — and there's little immediate relief in sight.
The Newark situation has so far resulted in massive delays, not calamity.
But radar and radio outages in such busy airspace, for any amount of time, present a serious safety threat.
Driving the news: Newark's problems over the past few days are fourfold.
Air traffic control staffing: The FAA last year moved controllers responsible for Newark approaches and departures from a facility on Long Island to Philadelphia, in a controversial bid to improve chronically short staffing.
Technical issues related to the FAA's move have caused multiple brief but harrowing moments where Newark controllers lost their radar feeds and radio frequencies. Several controllers went on trauma leave after those episodes — which left them without the tools required to keep hundreds of people safe at any given moment — exacerbating the staffing problems.
Long-plannedrunwaymaintenance is limiting the number of takeoffs and landings possible.
Bad weather over the last few days has complicated operations at Newark and across the broader New York City area.
By the numbers: Newark reported 377 delays and 150 cancellations on Tuesday, per FlightAware.
At one point Tuesday evening, average delays there were approaching a whopping six hours.
The big picture: Newark's troubles come as anxiety is already running high in the flying world only months after January's catastrophic mid-air collision over Washington, D.C.
Problems at Newark canreverberate through the entire air traffic system. If you're flying from Chicago to San Francisco but your plane is inbound from Newark, you could be affected.
State of play: Newark powerhouse United Airlines is cutting flights there and offering affected passengers the option to switch to LaGuardia or Philadelphia.
"It's disappointing to make further cuts to an already reduced schedule at Newark, but since there is no way to resolve the near-term structural FAA staffing issues, we feel like there is no other choice in order to protect our customers," United CEO Scott Kirby wrote in a May 2 letter.
What's next: The FAA announced a series of steps Wednesday it's taking to fix Newark's technical issues and controller shortages.
The agency is also slowing the pace of Newark arrivals and departures to alleviate pressure on the system.
Yes, but: It's unclear why some of these steps — like ensuring system redundancy — weren't taken before moving controllers from Long Island to Philadelphia.
The bottom line: None of the planned changes will fix Newark's woes overnight.
Nearly half the country may need Real IDs to board domestic flights starting Wednesday.
Why it matters: After years of delays, the Real ID deadline looks set to be finally, actually happening — and it could cause chaos at airports this week even after tons of warnings from the government, airlines, etc.
The big picture: Congress passed the Real ID Act back in 2005 to beef up aviation security post-9/11, but the deadline for actually requiring compliant ID cards has been repeatedly delayed.
Now that it's happening, Americans without a passport or a handful of other acceptable documents will need a Real ID to board domestic flights.
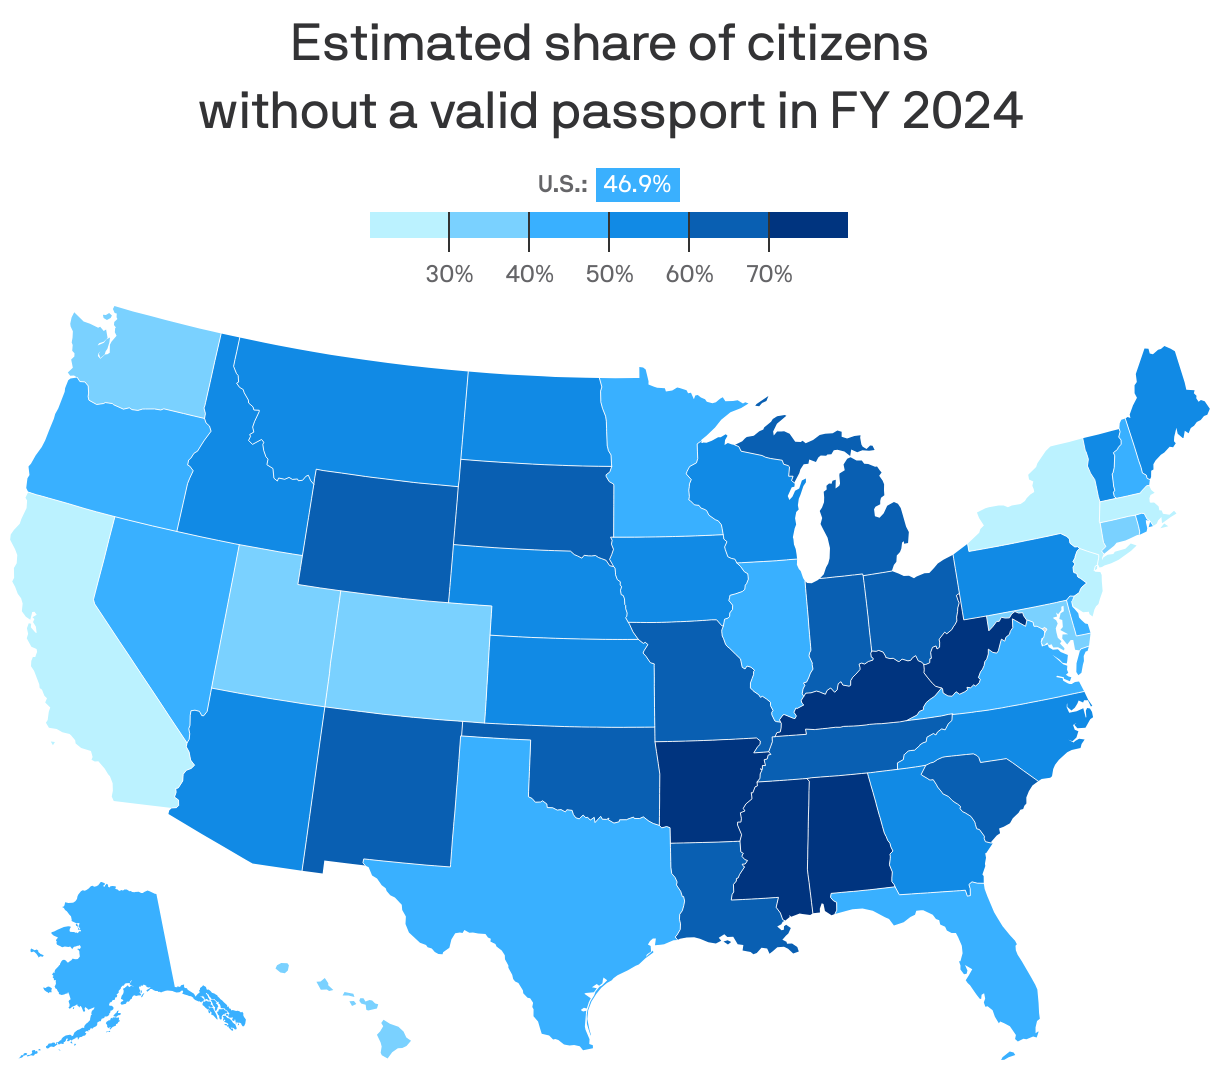
By the numbers: Nearly 47% of Americans lack a valid passport as of fiscal 2024, per estimates from the Center for American Progress, a think tank.
That's a decent measure of potential demand for Real IDs — though there are alternatives, including "enhanced" driver's licenses meant for international land or sea crossings. (See a full list of options here).
Zoom in: West Virginia (79.3%), Mississippi (77.9%) and Alabama (72.3%) have the greatest shares of citizens lacking a passport.
New Jersey (20.1%), California (28.2%) and Massachusetts (28.8%) have the smallest.
State of play: States' levels of Real ID adoption vary widely, per a CBS News analysis.
In New Jersey, for example, only 17% of IDs are Real ID compliant as of April.
Yes, but: Given that so many Garden State residents have a passport, they may not feel a huge need to upgrade their driver's license. (Why deal with the DMV if you don't have to?)
And many Americans don't fly regularly or at all — so may have no immediate need for a Real ID.
What's next: Passengers without a Real ID or viable alternative may still be allowed to fly once the rule takes effect, but "will be notified of their non-compliance, may be directed to a separate area and may receive additional screening," per a Transportation Security Administration info page.
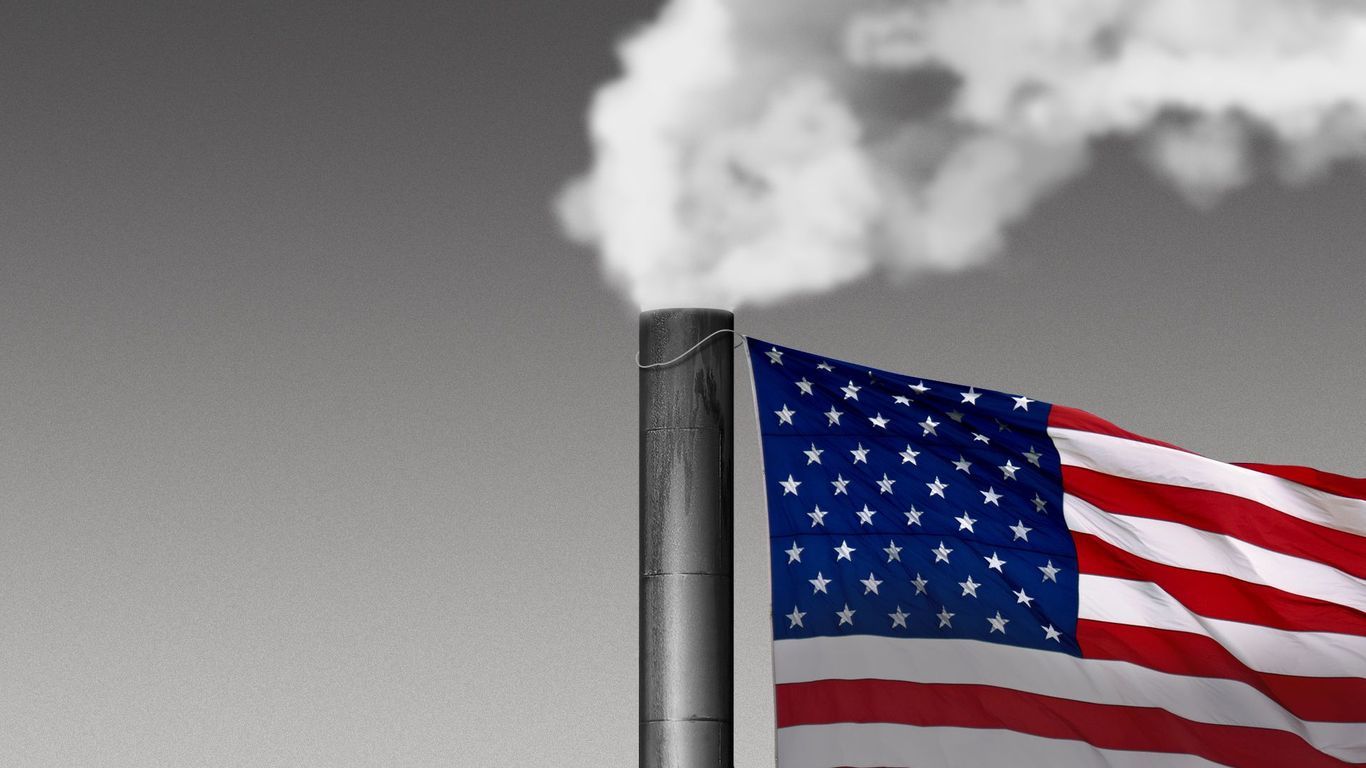
Nearly half of Americans are now exposed to potentially dangerous levels of air pollution, per a new report.
Why it matters: The findings, which predate the current Trump administration, come as the White House is reconsidering EPA rules and regulations meant to curb pollution and promote cleaner air.
Driving the news: Just over 156 million Americans — 46% of the population — are living in areas with unhealthy levels of ozone or particle pollution, per the American Lung Association's 2025 State of the Air report.
That's almost 25 million more compared to last year's report, and the highest number in the past decade of the report's history.
Between the lines: Extreme heat, wildfires and drought are degrading air quality nationwide, the Lung Association says. All have been linked to climate change.
Air pollution is associated with an array of health conditions, from wheezing and coughing to asthma and premature death.
How it works: The report uses local air quality data to grade and rank locations based on ozone pollution, daily particle pollution and annual particle pollution.
This latest report includes data from 2021-2023, "the most recent three years of quality-assured nationwide air pollution data publicly available."
Ozone is a gas that, at ground level, is a harmful irritant. Particle pollution involves tiny airborne particles from wildfires, fossil fuel burning and more.
Zoom in: Los Angeles, Visalia and Bakersfield — all in California — lead the Lung Association's new rankings of U.S. metros most affected by ozone pollution.
Bakersfield; Fairbanks, Alaska, and Eugene, Oregon, topped the list of those most affected by daily particle pollution.
Bakersfield; Visalia and Fresno, California, were the most affected by annual particle pollution.
Stunning stat: Hispanic people are almost three times more likely than white people to live somewhere with failing grades in all three categories.
The other side: Only one continental U.S. metro — Bangor, Maine — showed up on all three of the group's lists of cleanest cities.
The intrigue: The "geographic distribution of air pollution" shifted eastward towards the end of the covered period, the report notes.
"The year 2023 ... brought improved conditions to the West Coast but also a deadly heat wave in Texas and an unprecedented blanket of smoke from wildfires in Canada that drove levels of ozone and particle pollution in dozens of central and eastern states higher than they have been in many years."
What they're saying: "Clearly, we need to do more to control the pollutants that are impacting our changing climate and worsening the factors that go into the wildfires and the extreme heat events that are threatening our health, instead of thinking about how to roll them back," says Katherine Pruitt, senior director of nationwide clean air policy at the American Lung Association and report author.
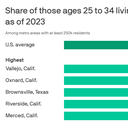
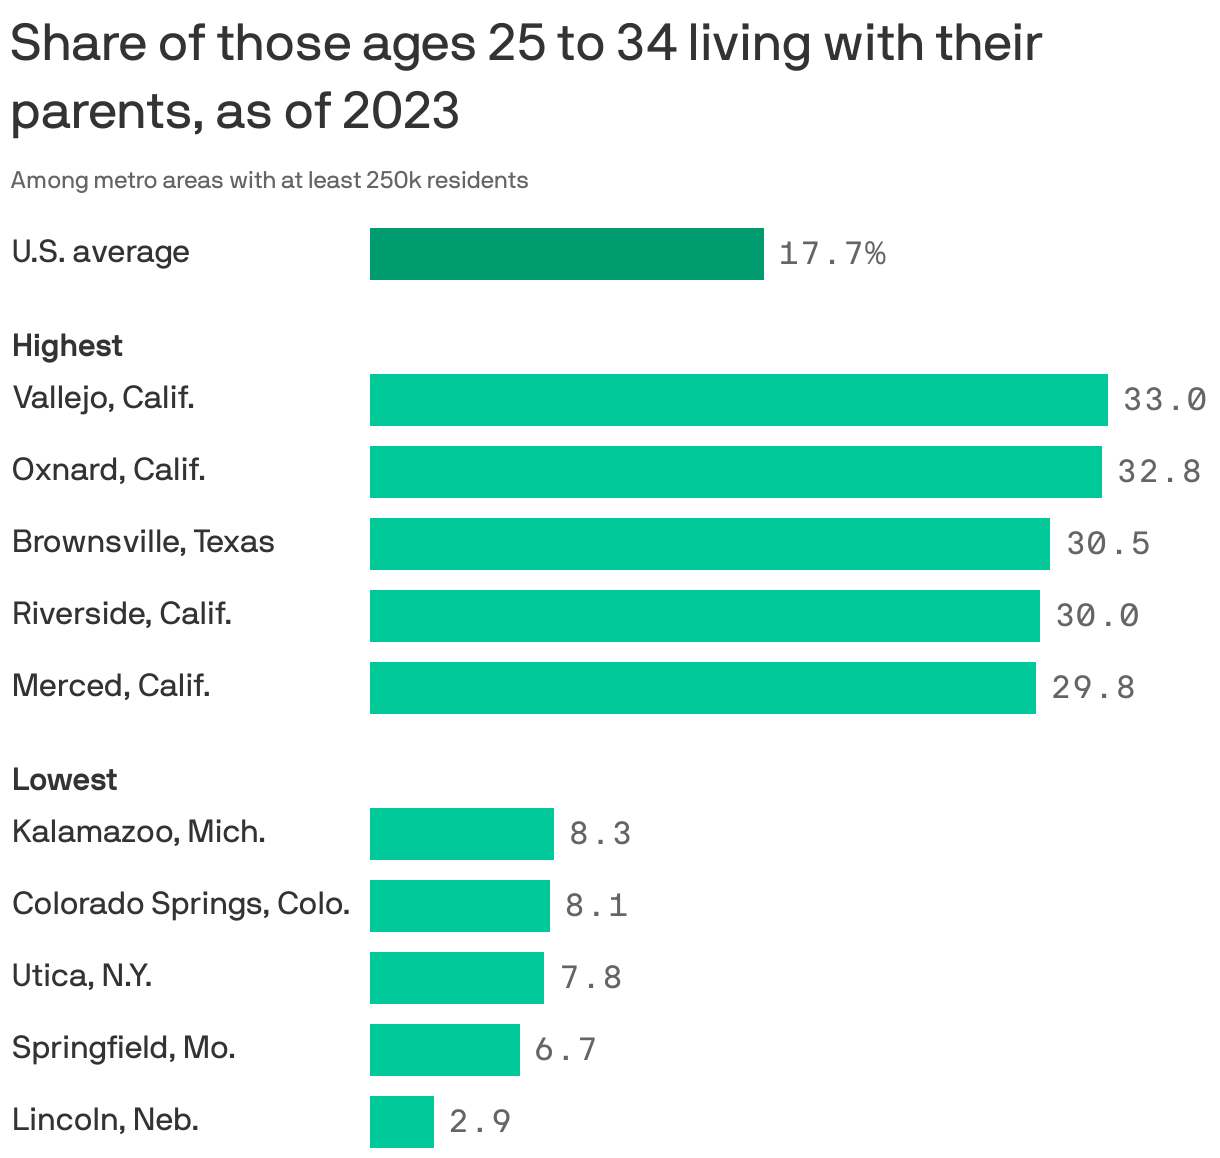
Data: Pew; Note: "Living with their parents" means residing in a household headed by a parent; Chart: Axios Visuals
California and Texas are home to the major U.S. metro areas with the greatest shares of young adults living with their parents, a recent analysis finds.
Why it matters: While living at home as a young adult is sometimes viewed negatively as a "failure to launch," it can also reflect economic realities, cultural preferences, caregiving needs, and other factors.
The big picture: Nearly 18% of U.S. adults aged 25-34 were living in a parent's home as of 2023, per a Pew Research Center analysis of census data.
That's down a bit after steadily increasing from 2000-2017, a period marked by multiple financial crises that changed the leaving-home calculus for many young adults.
Zoom in: Vallejo, California (33%), Oxnard, California (32.8%) and Brownsville, Texas (30.5%) have the highest shares of young adults living with their parents among U.S. metros with at least 250,000 residents, per Pew.
Lincoln, Nebraska (2.9%); Springfield, Missouri (6.7%) and Utica, New York (7.8%) have the smallest shares.
Between the lines: Metros with more white young adults than average tend to have lower-than-average shares of young adults overall living with their parents.
That jives with longstanding findings that white young adults are less likely than others to live with their parents, per Pew.
The intrigue: While some areas with relatively high shares of young adults living at a parent's home also have relatively steep housing costs, Pew didn't find a clear link between those factors.
The bottom line: Even when young adults do move out, they often wind up close to home anyway.
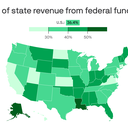
Federal funding makes up 40% or more of overall revenue in nearly half of U.S. states, per the latest available data.
Why it matters: The Trump administration and congressional Republicans are looking for ways to cut federal spending, and some states may be more vulnerable than others to major decreases.
By the numbers: As of 2022, federal funding accounts for the greatest shares of state revenue in Louisiana (50.5%), Alaska (50.2%) and Arizona (49.7%).
It accounts for the smallest shares in North Dakota (22.2%), Hawai'i (25.9%) and Virginia (27.6%).
Stunning stat: Total federal grants exceeded $1 trillion in 2022 for the first time, per Pew.
Context: Federal funding's share of overall revenue in any given state can fluctuate from year-to-year depending on overall federal spending levels, state tax collections and more.
States have been getting more federal funding than usual in the past few years due to COVID-19 and infrastructure spending.
Reality check: Federal funds making up a high percentage of revenue isn't necessarily a problem for states, depending on their ability to raise money through taxes and other means.
Yes, but: Big losses in federal dollars can leave states scrambling for alternate funding for federally-supported programs and projects, or cancel them entirely.
Case in point: FEMA is cutting $325 million in grants largely meant for flood mitigation in New York.
"No state in the nation can backfill the massive cuts being proposed in Washington," New York Governor Kathy Hochul said in response earlier this month.
What we're watching: Whether the second Trump era results in a notable, broad decrease in federal funding to states — and how states react.
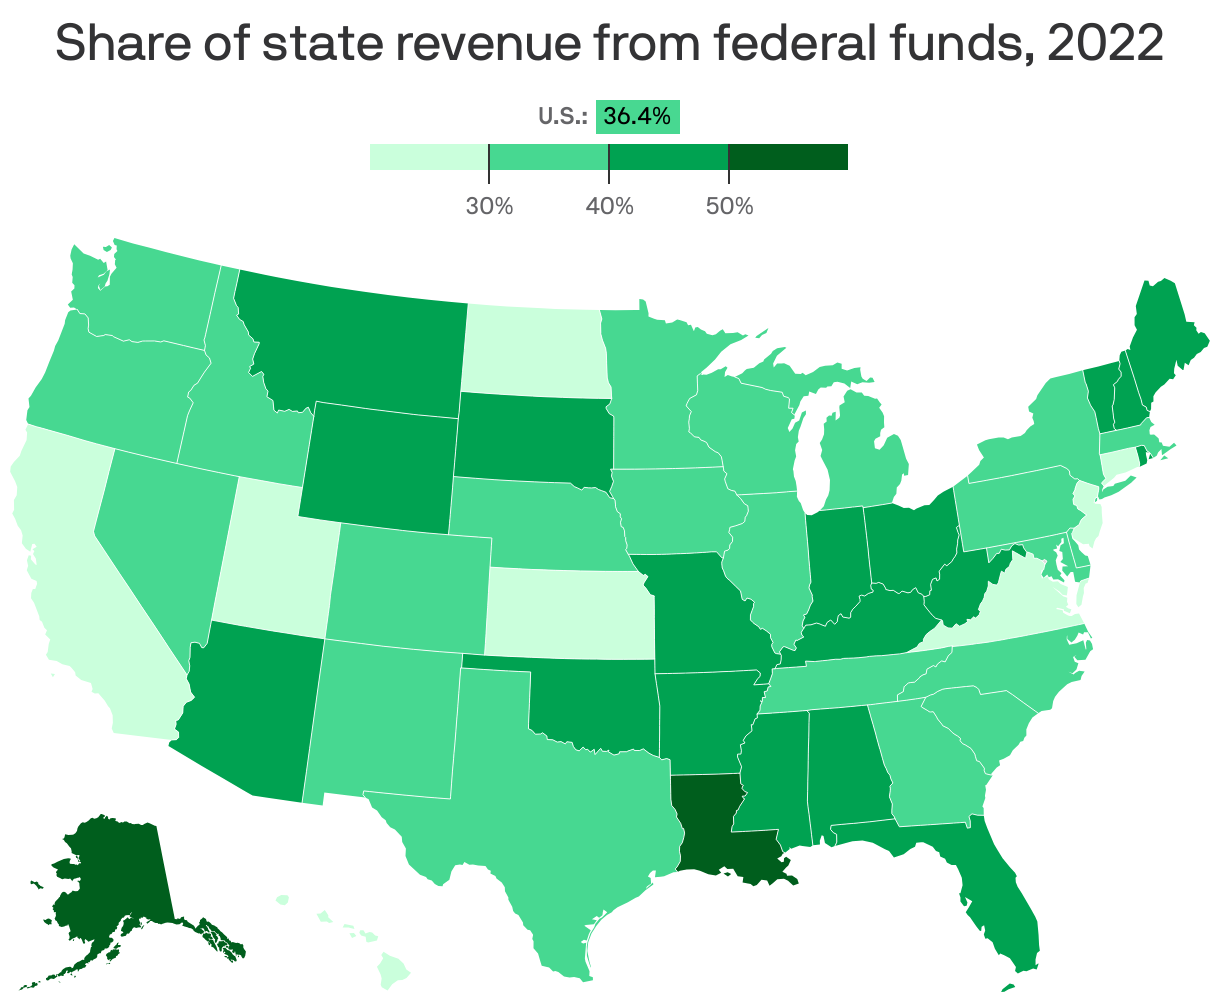
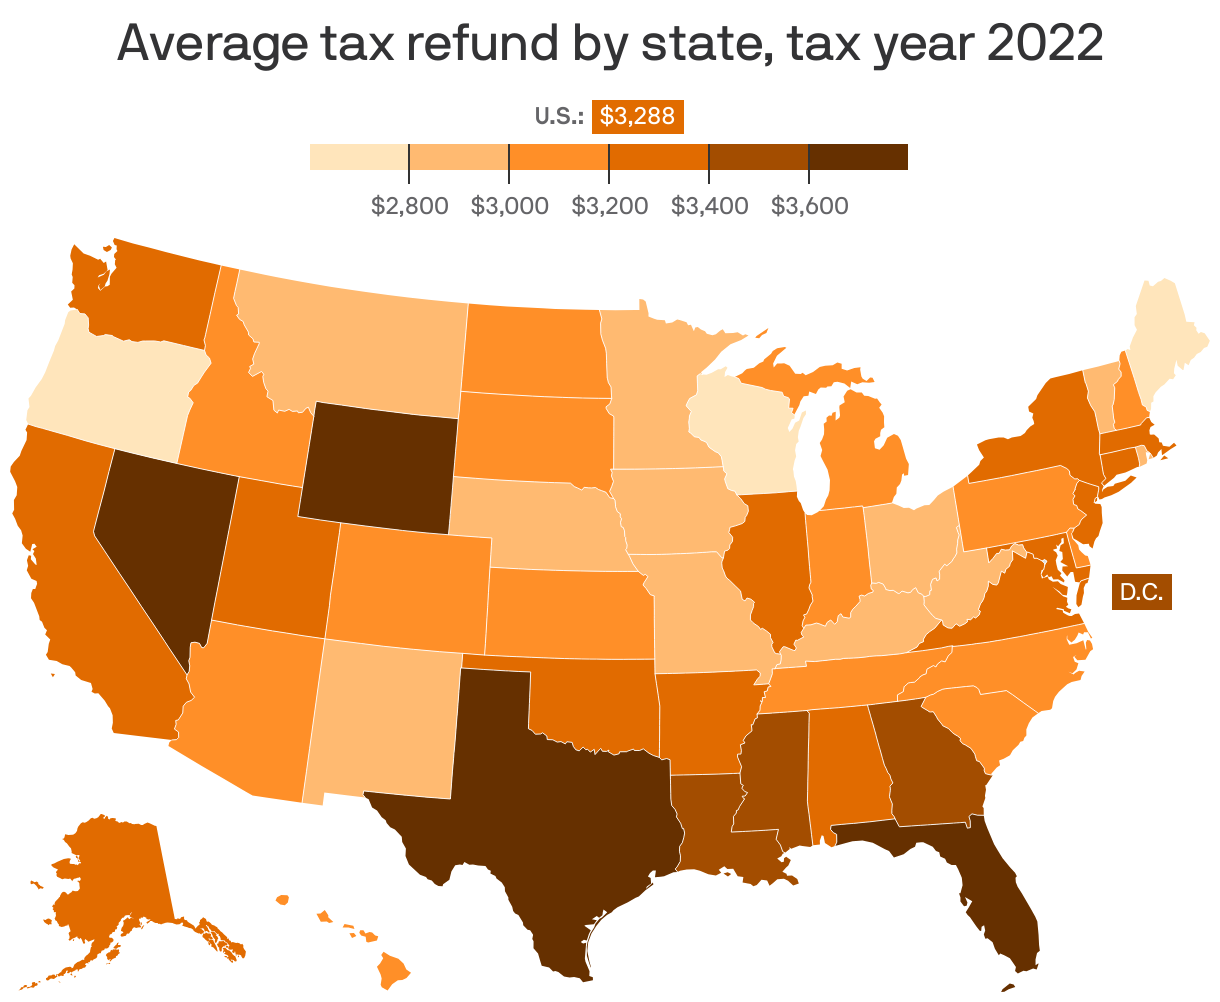
Among filings receiving a refund. Data: IRS; Map: Alex Fitzpatrick/Axios.
Average federal tax refunds by state range from about $2,700 to nearly $4,000, per IRS data.
Why it matters: Millions of taxpayers have received or are expecting refunds as tax filing season ends Tuesday.
By the numbers: Florida (about $3,900), Texas ($3,800) and Wyoming ($3,700) had the biggest average tax refunds for tax year 2022, the latest data available.
Maine ($2,700), Wisconsin ($2,700) and Oregon ($2,800) had the smallest.
How it works: That's among filings for those owed a refund and who chose not to apply that refund to their next year's taxes.
Differences between states are tied to residents' income levels, withholding selections and other variables.
Pandemic-era job losses, stimulus checks and tax breaks also had an impact in the past few years.
The big picture: Nearly 68% of federal tax filings resulted in a refund in tax year 2022.
Between the lines: While many people eagerly await their tax refunds as a kind of bonus, it's really just money you temporarily loaned to the government at 0% interest.
Some personal finance pros encourage folks to set up their paycheck withholdings to get the smallest possible refund.
Any difference can be saved or invested elsewhere for better potential returns.
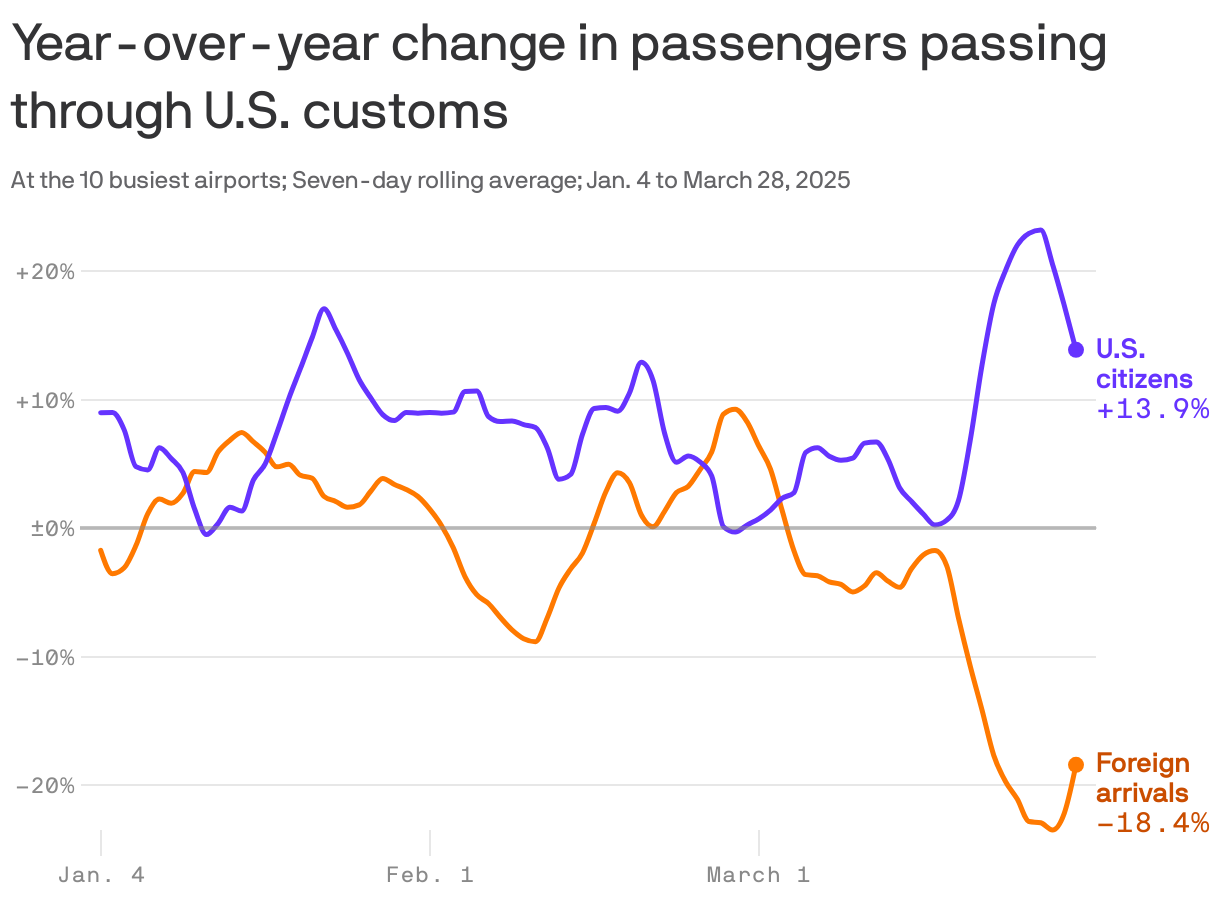
Foreign arrivals into major U.S. airports tumbled in mid-to-late March compared to the same time last year, based on customs pass-through data.
Why it matters: The findings suggest a sudden reluctance to visit the U.S. isn't a purely Canadian phenomenon and should sound alarm bells for the country's $1 trillion-plus travel industry.
Driving the news: Thenumber of foreigners passing through customs at the 10 busiest U.S. airports fell by over 20% year over year toward late March, based on a seven-day rolling average.
A sight uptick followed, but the number was still down 18.4% as of March 28 versus the same time last year.
Compare that to the number of U.S. citizens returning to the country, which was up nearly 14% by late March from the year earlier.
Context: Spring break may have played a role here, and many people book trips in advance with little flexibility.
Between the lines: Trade wars, a volatile economic and political climate and fears of detainment or harassment may be dissuading foreigners from visiting the U.S.
Several American allies, including Canada, France, Germany and others, recently issued new travel warnings or advisories about U.S. travel.
Some of those warnings focus on transgender and nonbinary travelers, following President Trump's recent order mandating that passports "accurately reflect the holder's sex," which his administration says is "not changeable."
What they're saying: "We're certainly starting to hear reports from international airlines about a softening of demand to the U.S.," Sean Cudahy, aviation reporter at The Points Guy, tells Axios via email.
"Based on some of the route cuts and overall sentiment we're hearing from airlines, I wouldn't be surprised to see the arrivals rates for international travelers drop even further in the coming weeks."
Zoom in: Some of the "divergence" between foreign arrivals and U.S. returnees (charted above) "is likely attributable to tighter immigration policy," reads a March 31 Goldman Sachs note.
"But the timing of the pullback in foreign arrivals — which emerged after tariff news escalated in both early February and early March — suggests that a more antagonistic policy stance by the Trump administration is contributing to a voluntary decline in visits."
Threat level: Goldmanpredicts a pullback in foreign tourism plus boycotts of American goods abroad will cause a "modest drag" on U.S. GDP of about 0.1%.
"Although small, this headwind provides an additional reason why U.S. GDP growth will likely underperform consensus expectations in 2025," reads the note.
What's next: Goldman's note predates Trump's sweeping new tariffs issued Wednesday, which stand to uproot the global economic order in unpredictable and chaotic ways.
If those tariffs hold, they could amplify any potential hit to U.S. travel businesses — but their impact remains difficult if not impossible to predict.
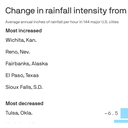
Data: Climate Central; Note: Includes weather stations in cities with sufficient data quality; Chart: Kavya Beheraj/Axios
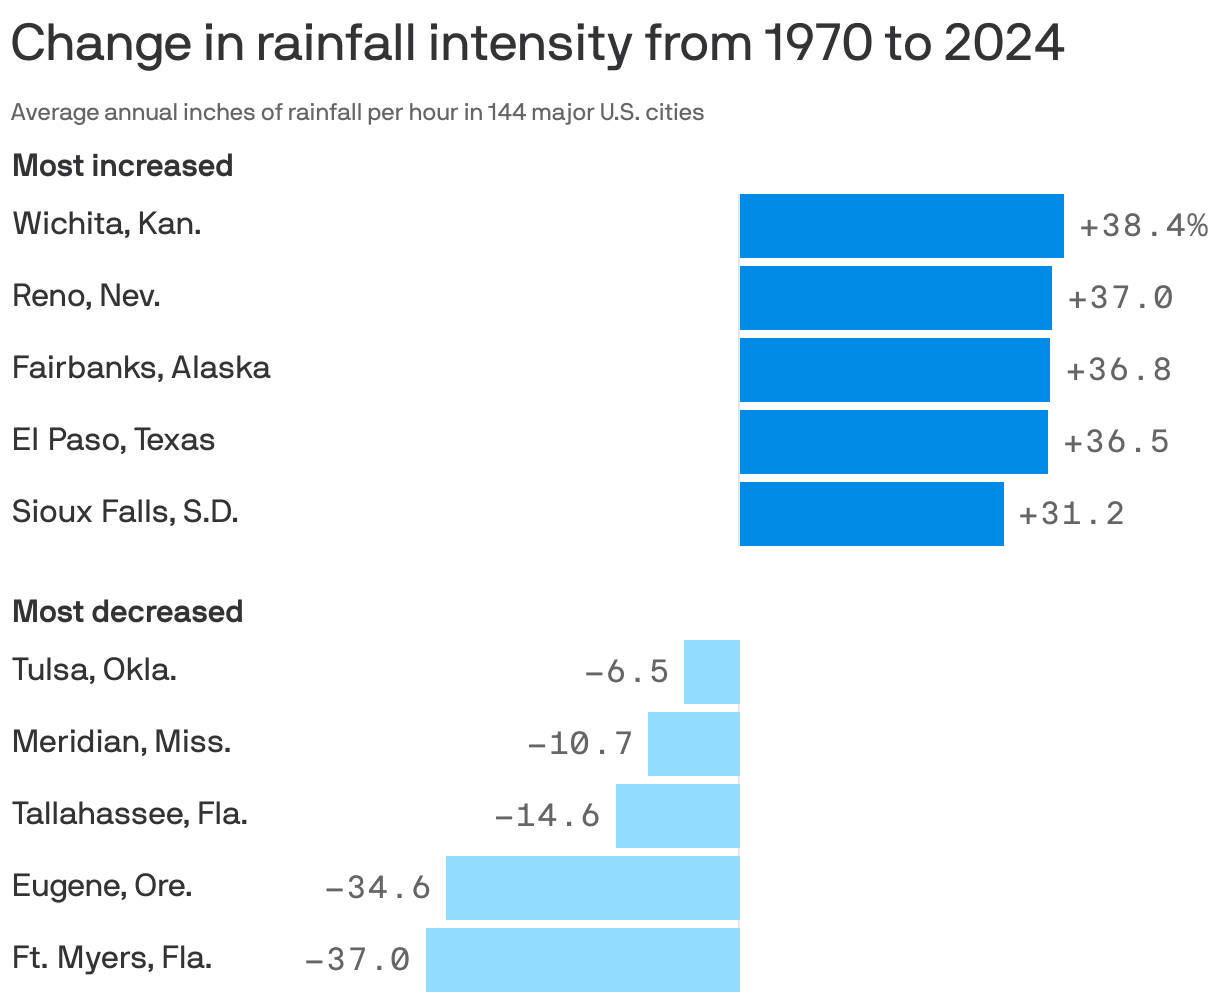
Rainstorms are getting more intense in many U.S. cities amid human-driven climate change, a new analysis finds.
Why it matters: More intense precipitation events can cause flash-flooding, landslides, dangerous driving conditions and other potentially deadly hazards.
Driving the news: Hourly rainfall intensity increased between 1970 and 2024 in nearly 90% of the 144 locations analyzed, per a new report from Climate Central, a research and communications group.
Among the cities with an increase, hourly rainfall intensity rose by an average of 15%.
How it works: The researchers divided each location's total annual rainfall by its total hours of annual rainfall, using NOAA weather station data.
That approach quantifies how much rain fell for each hour it was raining in a given year — in other words, rainfall intensity.
Some locations were not included because their stations haven't consistently collected hourly precipitation data.
Between the lines: Human-driven climate change is resulting in warmer air, which holds more moisture and thus can drive more intense precipitation.
Hotter temperatures also evaporate more water vapor from lakes, oceans and vegetation.
Zoom in: Wichita, Kansas (+38%), Reno, Nevada (+37%) and Fairbanks, Alaska (+37%) had the biggest gains in hourly rainfall intensity between 1970 and 2024, per the analysis.
That Reno is in the top three underscores Climate Central's point that rainfall intensity is rising in places that are generally dry, not just those that get at least a decent amount of annual rainfall.
Threat level: Flooding costs the U.S. economy up to nearly $500 billion annually, by one estimate, and is creating "climate abandonment" zones as people flee for safer areas, Axios' Andrew Freedman reports.
Researchers have also found that predominantly Black coastal communities may be particularly vulnerable to increased flood risk over the coming decades, Climate Central notes.
What's next: The group recommends that people stay aware of their area's flooding risks, and suggests homeowners carry flood insurance and improve their home's resiliency against flooding as able.
Canadians' desire to visit the U.S. is absolutely tanking, new data suggests.
Why it matters: President Trump's tariffs and insistence that Canada should become the 51st American state is fueling a remarkable rally-round-the-flag effect. Canadian patriotism is skyrocketing alongside disdain for all things American throughout the Great White North.
Driving the news: Advance bookings for Canada-U.S. flights in April-September are down over 70% compared to this time last year, per aviation data firm OAG.
"This sharp drop suggests that travelers are holding off on making reservations, likely due to ongoing uncertainty surrounding the broader trade dispute," writes OAG chief analyst John Grant.
Airlines are also reducing transborder capacity — a strong signal that they, too, are seeing (or at least predicting) less demand.
Yes, but: At least one airline is calling OAG's data into question.
The numbers are "not reflective of Air Canada's booking patterns, nor the state of the market, based on all information sources available to us," an Air Canada spokesperson told travel news site The Points Guy (TPG).
Yet the spokesperson confirmed there's been a "softening" in demand, and the airline has trimmed capacity accordingly.
Threat level: A mere 10% drop in Canadian visitors could cost U.S. businesses as much as $2.1 billion in revenue, TPG notes.
The big picture: Airline stocks are suffering mightily amid economic uncertainty and the prospect of continued trade wars.
Delta Air Lines, United Airlines and American Airlines are all down around 30-40% so far this year.
Several major airlines, including Delta and American, previously warned of soft first quarters amid weakening consumer demand.
What's next: Reluctance to visit the U.S. this summer may not be a strictly Canadian phenomenon, with worries about political strife and detainment upon entry an increasingly popular theme on travel message boards and chat groups in recent weeks.
If those fears materialize into less demand, there could be big consequnces for the entire $1.2 trillion U.S. travel industry.
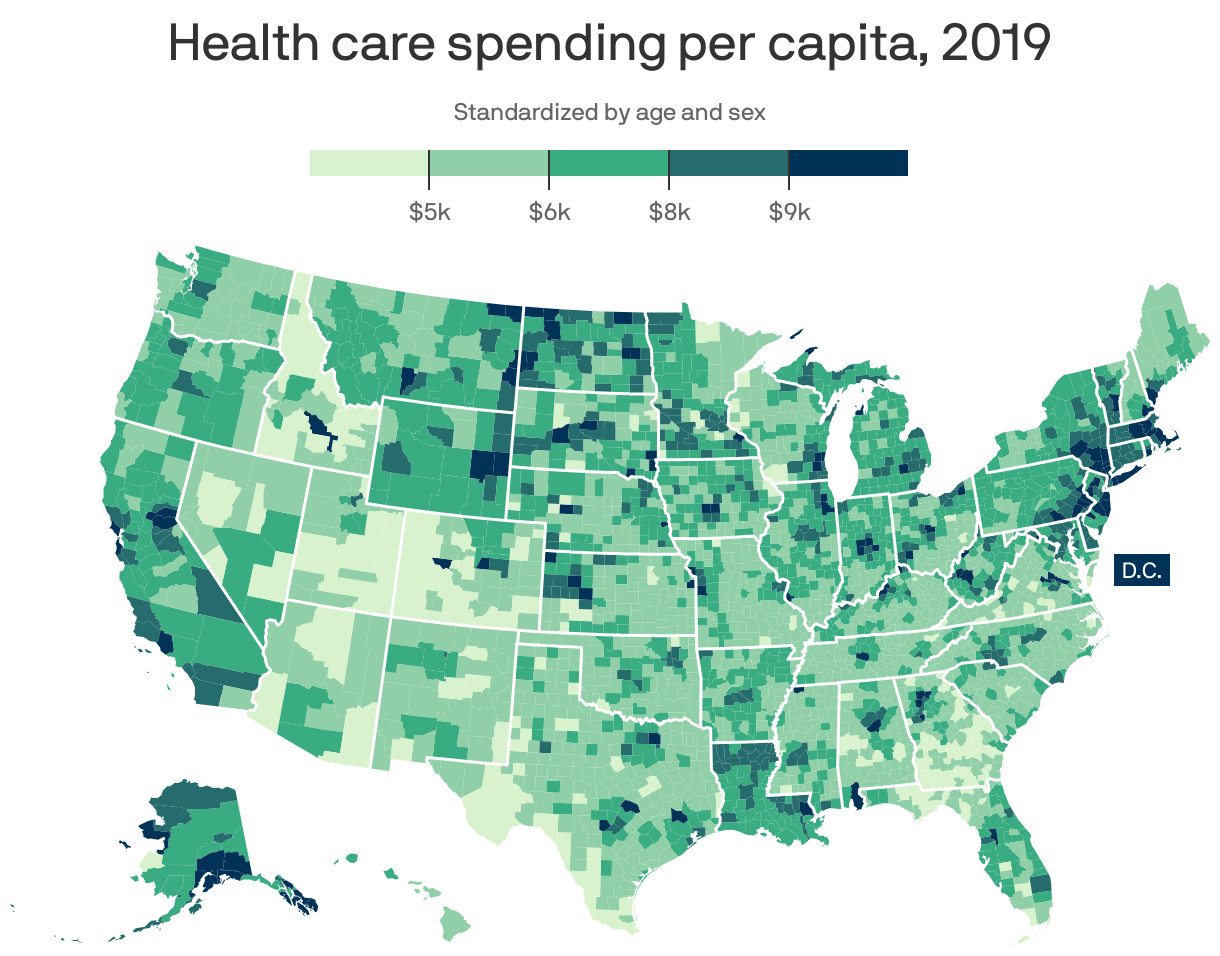
Data: Dieleman JL, Beauchamp M, Crosby SW, et al; Map: Alex Fitzpatrick/Axios
Long Island; Washington, D.C. and California's Bay Area had the country's highest health care spending per capita in 2019 — the most recent year covered by a new study.
Why it matters: Medical spending is surging nationwide, with demand and other factors pushing it to a projected $7.7 trillion by 2032 — but actual spending varies from county to county.
Driving the news: In a study published in the March 25 issue of JAMA, researchers analyzed Americans' health care spending using data from billions of insurance claims and hundreds of millions of hospital visits and admissions for 2010 through 2019.
The analysis includes health care spending via private insurance, Medicaid and Medicare, plus out-of-pocket spending.
Some health care-related categories, including OTC drugs and medical transportation, were not included — nor was Veterans Affairs spending.
The result is a sweeping county-level view reflecting the personal health care spending of nearly the entire U.S. population.
By the numbers: Health care spending per capita in 2019 was highest in Nassau County, New York (about $13,300); Suffolk County, New York ($12,700) and Washington, D.C. ($12,500), the researchers found.
Clark County, Idaho ($3,400); Loving County, Texas ($3,900) and Kennedy County, Texas ($4,000) had the lowest such spending.
Between the lines: The county-level findings tend to reflect broader cost-of-living realities.
Nobody moves to Long Island, D.C. or the Bay Area in search of value for their dollar.
Stunning stat: The single health condition with the most associated spending? Type 2 diabetes, at $143.9 billion in 2019.
"Between 2010 and 2019, spending on type 2 diabetes increased at a rate of 1.9% after adjusting for inflation and age/sex and size of the population," per the study.
Caveat: The study doesn't capture health care spending during or immediately after the COVID-19 pandemic and the inflationary period that followed.
Go deeper: The data is also available via an online interactive breaking it down by type of care, specific conditions, and more.
Editor's note: This story has been corrected to show that the Clark County it refers to is in Idaho (not Iowa).
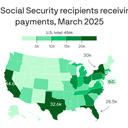
Data: Social Security Administration; Map: Alex Fitzpatrick/Axios
Nearly half a million Americans will be affected by President Trump's order that will cease Social Security payments by paper check.
Why it matters: The switch risks disrupting the financial lives of some of the most vulnerable Americans, at a time when Social Security is cutting back services to help them.
Driving the news: The federal government must stop issuing paper checks by Sept. 30 in favor of direct deposit, prepaid cards, or "other digital payment options," per an order Trump signed yesterday.
The move is part of a broader White House effort against what it considers government waste, fraud and abuse.
The order includes language allowing for "limited exceptions," including for people without bank accounts.
By the numbers: Nearly 456,000 Americans are still receiving paper Social Security checks as of March, per Social Security Administration data.
That's about 0.7% of the approximately 68.2 million total recipients.
What they're saying: "The continued use of paper-based payments ... imposes unnecessary costs; delays; and risks of fraud, lost payments, theft, and inefficiencies," per Trump's order.
"Maintaining the physical infrastructure and specialized technology for digitizing paper records cost the American taxpayer over $657 million in Fiscal Year 2024 alone."
Between the lines: Social Security recipients are by definition on the older side, and some may struggle with any changes — particularly those who have long been able to switch to direct deposit but have not done so.
The Social Security Administration is simultaneously rushing to cut phone services at the White House's request, Axios' Emily Peck reports.
But over-the-phone help is exactly the kind of assistance many affected recipients may need before September's deadline.
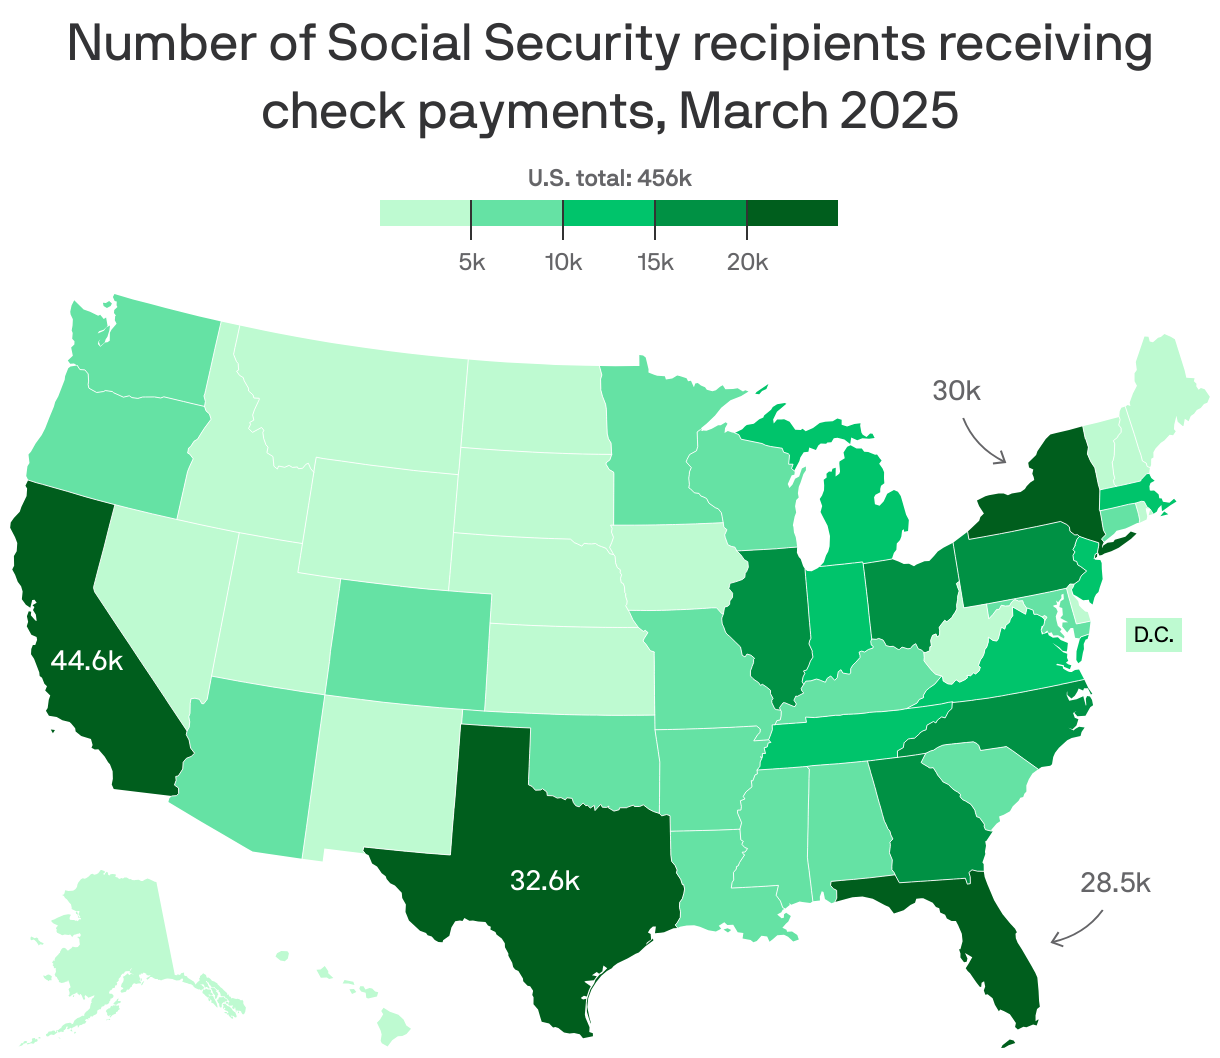
Your annual tax bill depends at least partly on where you live, with state income taxes varying from nonexistent all the way up to nearly 14% for some especially high earners.
By the numbers: California (13.3%), Hawai'i (11%) and New York (10.9%) have the highest top marginal income tax rates for individuals.
Arizona and North Dakota (both 2.5%) have the lowest among states with an income tax.
How it works: That's according to data from the Tax Foundation, a nonpartisan think tank.
Local taxes, as well as some state-specific taxes in a handful of states and a capital gains surtax on high earners in Minnesota, are not included.
Between the lines: The rates shown in the map above are the highest paid by the residents earning the most money.
Many states have graduated income taxes, with higher amounts of income taxed at gradually higher rates.
New York's tax rates, for instance, range from 4% to 10.9%.
Yes, but: Several states, including Arizona, Idaho, Illinois and more, have a flat income tax — meaning everyone pays the same rate regardless of their income.
There are a few other interesting caveats, too. Washington, for example, has no general income tax, but it does tax capital gains above a certain threshold.
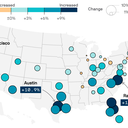
America's metros are growing faster than the country overall, driven largely by foreign immigration, per the U.S. Census Bureau.
Why it matters: An exodus of city-dwellers rocked many U.S. metros during the COVID-19 pandemic, but some are now clawing back residents (and their productivity, creativity, tax dollars, etc.)
Driving the news: The number of people living in U.S. metro areas rose by almost 3.2 million between 2023 and 2024, the Census Bureau said today — a gain of about 1.1%.
By comparison, the total U.S. population rose by 1% during that time.
Nearly 90% of U.S. metro areas grew from 2023 to 2024, the bureau says.
Zoom in: Some metros hit hardest by pandemic population loss — think New York; Washington, D.C. and San Francisco — grew between 2023 and 2024, though some are still down relative to 2020, as seen above.
Between the lines: Cities can thank international migration for this latest population spike.
"All of the nation's 387 metro areas had positive net international migration between 2023 and 2024, and it accounted for nearly 2.7 million of the total population gain in metro areas," the bureau said in a statement accompanying the new data.
How it works: The bureau bases these estimates on current data for births, deaths and migration, all of which affect overall population.
What's next: Demographers and other researchers will be keeping a close eye on how Trump administration policies might affect immigration levels.
Driving the news: Axios spoke to six current and retired air traffic controllers and instructors, all of whom requested anonymity because they are not authorized to speak to the press.
Controllers have so far been spared from President Trump's mass firings, though other FAA employees have gotten the ax, raising safety concerns.
What they're saying: "I have friends and family [asking], 'Should I get on an airplane?'" one retired controller tells Axios.
"And I'm like, well, it's not there yet. But it seems to be trending that way."
"I don't believe that if these people really cared about safety, that they would be doing the things that they're doing."
A currently working controller brought up their concerns over staffing shortages, a long-standing issue.
"My biggest fear is an over-exhausted controller who has to work a combined position because of staffing misses something," they say, referring to one controller working multiple posts simultaneously at their location.
That's common at some facilities during quieter periods, but it can divide controllers' attention.
Another controller believes it's still safe to fly "in general," thanks to those behind the radar screens.
"It is safe not because of the FAA's policies. It is not safe because of who the president is or because of who the president was," the controller says.
"It's safe because there's people that go in every single day and they work their ass off to make sure that it's safe."
The other side: "We continue to hire and onboard air traffic controllers and safety professionals, including mechanics and others who support them," the FAA said in a statement.
"Air traffic controllers deal with and have to manage stress, day in and day out," Nick Daniels, president of the National Air Traffic Controllers Association, said during a March 4 House hearing. "Anything that adds to that, any uncertainty, is what brings an added risk that has to be evaluated into the system."
NATCA declined to make Daniels available or otherwise comment for this story.
Their ideas: One controller proposed a second ATC school to complement an existing Oklahoma facility, but an instructor at that facility says low pay has led to a teacher shortage and smaller classes.
Another says young new controllers are often thrown into high-paced, understaffed facilities — New York approach, for example — like "cannon fodder into the slaughter," leading to higher training times and failure rates.
Yet another suggests hiring more controllers to train and work at understaffed facilities near home, rather than being assigned elsewhere in the country after initial training, as often happens.
Follow the money: Higher pay and better scheduling are pretty much universal wants.
TransportationSecretary Sean Duffy recently claimed that controllers make $160,000 on average three years out of the academy.
But several controllers told Axios that's a rosy view, with some making far less — sometimes while stationed in high-cost areas — and without clear growth opportunities.
Controllers made a median of $137,400 in 2023, per Labor Department data.
Friction point: Air traffic controllers can't legally strike, limiting their bargaining power.
And when controllers struck in 1981, President Reagan fired thousands — a memory that runs deep in controllers' collective psyche.
The latest: Duffy has floated raising the mandatory ATC retirement age from 56, while Elon Musk called for retired controllers to return to work.
The FAA also recently increased pay for initial trainees from about $18/hour to about $23/hour and opened a new ATC hiring window.
Reality check: Retirees would still need to be retrained before plugging in and working traffic, controllers tell Axios.
And some controllers become eligible for retirement before 56, leaving for other jobs or pursuits while collecting their pensions.
"If your base salary is 130K and your pension is 60K, now you're working for 70K a year," one controller says. "Is it worth it for 70K a year? Could you find something else? So guys are walking away, and they're not making it to 56."
The intrigue: Duffy recently blocked efforts by Musk's DOGE to fire controllers, per New York Times coverage of a meeting of Trump's Cabinet earlier this month.
Musk reportedly denied that DOGE made any such attempt.
Also during that meeting, Trump reportedly told Duffy to hire "geniuses" from MIT to be controllers.
When asked about that comment, one controller replied: "I seriously doubt people with degrees from MIT want six-day workweeks on our rotating schedules for our salaries."
What's next: If the government shuts down Friday, controllers will still be made to work, but with suspended pay — no doubt further eroding morale.
Yet controller sickouts played an under-appreciated role in ending the last major government shutdown, and it doesn't take many absences for delays and cancellations to start mounting.
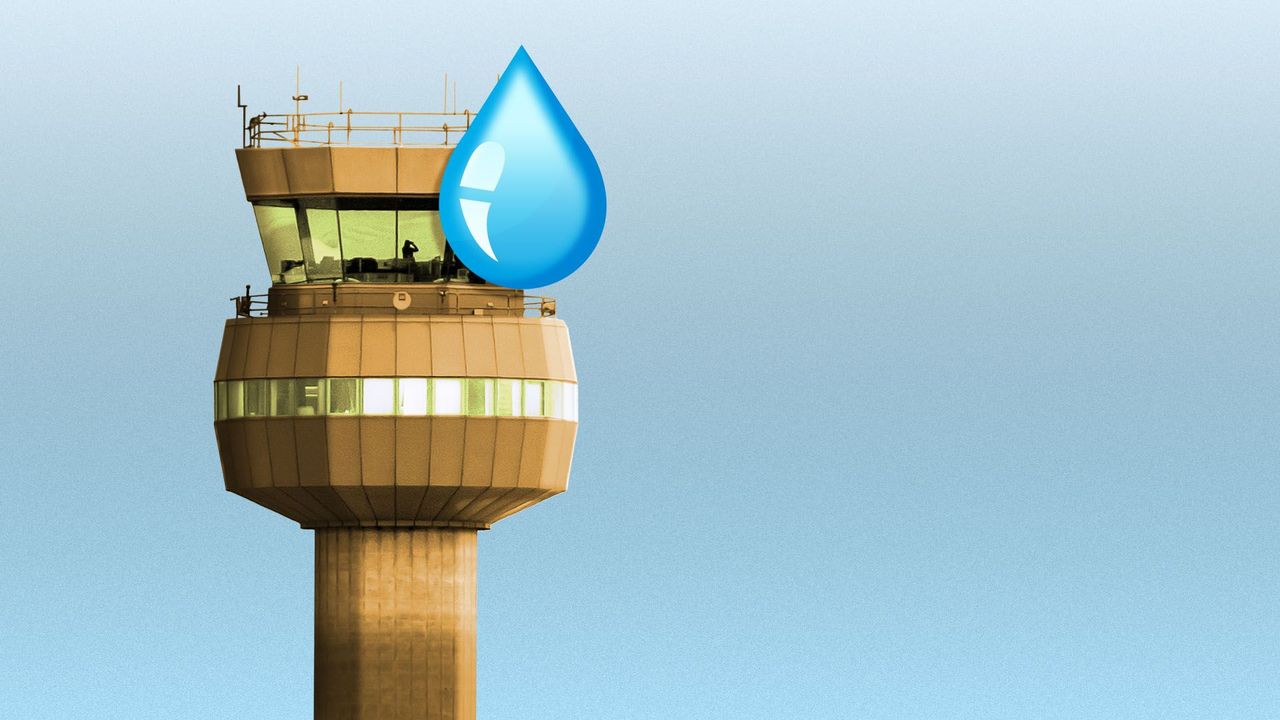
Most major U.S. cities are suffering from longer allergy seasons amid human-caused climate change, a new analysis finds.
Why it matters: Millions of Americans endure runny noses, itchy throats, and worse health effects each spring allergy season.
Driving the news: The freeze-free growing season lengthened between 1970 and 2024 in nearly 90% of the 198 cities analyzed by Climate Central, a research and communications group.
Among those cities, the freeze-free season lengthened by 20 days on average.
How it works: Climate Central uses the freeze-free period — the number of consecutive days with minimum temperatures above 32°F — as a proxy for allergy season.
Above-freezing temperatures allow for better plant growth, and thus the release of more sneeze-inducing pollen.
Zoom in: Reno, Nevada (96 more consecutive freeze-free days from 1970 to 2024); Myrtle Beach, South Carolina (52) and Toledo, Ohio (45) have had some of the biggest increases among the cities analyzed.
Conversely, the number of consecutive freeze-free days decreased in places like Waco, Texas (-14); Tulsa, Oklahoma (-14), and Denver, Colorado (-8).
Between the lines: "Climate change makes pollen seasons not only longer, but also more intense due to heat-trapping pollution," per Climate Central's report.
"Higher levels of planet-warming CO2 in the air can boost pollen production in plants, particularly in grasses and ragweed."
Threat level: Nationwide pollen production stands to dramatically increase alongside high CO2 pollution, per a 2022 study highlighted in the report.
The bottom line: Pass the allergy spray, would ya?
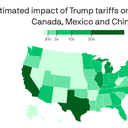
Data: Trade Partnership Worldwide; Note: Based on January-November 2024 trade data. Map: Alex Fitzpatrick/Axios
President Trump imposed sweeping tariffs Tuesday on America's largest trading partners, triggering a global trade war that promises to affect the wallets of everyday Americans.
Why it matters: After running — and winning — on a promise to curb inflation, Trump's trade war threatens to raise prices for everything from food and clothes to cars and computers.
Some estimates suggest just Tuesday's tariffs alone could cost the average U.S. household $830 a year — and that's before you factor in the cost of anticipated retaliatory tariffs from Canada, China and Mexico.
Already, the impacts are escalating — the map above, for example, was based on a 10% China tariff, which has now been raised to 20%.
Tariffs on the top U.S. import partners
Note: Countries are arranged by share of total trade; Data: U.S. Census Bureau; Chart: Axios Visuals
Zoom out: More than 40% of all U.S. imports come from Mexico, Canada and China — over $1.3 trillion worth in 2024 alone, per Census data.
The tariffs will affect big-ticket items like machinery and cars, but also consumer staples — everything from beer (more than 80% of U.S. imports come from Mexico) to oats (almost all U.S. imports come from Canada).
Zoom in: Tariffs are generally regressive, in that they more heavily affect lower-income people who spend a greater share of their resources on goods, particularly necessities like food and fuel.
As data from the Progressive Policy Institute shows, even before Trump's new levies this week, the existing U.S. tariff system already charged much higher rates for low-cost products than their luxury counterparts.
Between the lines: Tariffs, especially on China, do move the needle on trade a little, but over time it tends to rebound.
The trade deficit with China has been more than $200 billion for 20 years now, and Chinese retaliatory tariffs will offset some of the benefit of the new duties Trump assessed.
Fentanyl realities
Data: U.S. Customs and Border Protection; Chart: Axios Visuals
The intrigue: In assessing tariffs on Canada and Mexico in particular, Trump cited the flow of fentanyl across both borders.
Yes, but: As U.S. Customs and Border Protection data shows, over the last 40 months, fentanyl volume that's trafficked through Mexico is almost 1,000x the amount coming through Canada.
In January 2025 alone, CBP stopped almost half a ton of fentanyl at the Mexican border — and about half an ounce at the Canadian border.
The next tariffs
Data: Axios research; Note: The White House has not specified which of the above tariffs (if any) will be included in the reciprocal tariff order on April 2 ; Chart: Axios Visuals
What to watch: The tariffs are a long way from over — the White House has made clear more are coming, and they'll stack up on top of each other.
Steel and aluminum tariffs come in next week, which will particularly impact automakers and beverage companies, among others.
Reciprocal tariffs on April 2 could affect dozens of countries, with as-yet unknown impacts on almost everything the country imports.
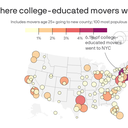
Data: U.S. Census Bureau; Map: Alex Fitzpatrick/Axios
New York City; Washington, D.C., and Dallas are the hottest destinations for college-educated Americans leaving their home county, per the latest census data.
Why it matters: White-collar workers tend to go where they think the jobs are, and cities are constantly competing with one another to attract well-paid professionals — and the tax revenue they often bring.
By the numbers: Among Americans age 25 and up with a bachelor's degree or better who moved to a new county in 2023, 6.1% went to NYC, 3.5% to D.C. and 3.2% to Dallas.
They're followed up by Atlanta (2.9%), Los Angeles (2.4%) and Chicago (2.4%).
Other hotspots: Denver (2.4%), Boston (2.2%) and San Francisco (2.1%).
How it works: These numbers are based on the 2023 one-year American Community Survey and include people who moved in the year prior to answering the survey.
The bottom line: The time-old tale of New York being a big draw for white-collar workers holds true as ever, but plenty of other cities are getting a piece of the action, too.
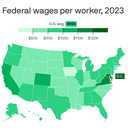
Washington, D.C., Maryland and Virginia have the highest federal wages per worker, Labor Department data shows.
Why it matters: The Trump administration's attempts to cut the government workforce is likely to hit particularly hard in places with the most federal workers, and where those workers take home the biggest paychecks.
By the numbers: Federal workers in D.C. make about $136,000 per worker, those in Maryland make about $126,000 per worker, and those in Virginia make about $111,000 per worker.
All three areas also rank in the top five for most federal workers overall.
D.C. has about 191,000 federal workers, Virginia has 189,000, and Maryland has 158,000.
How it works: This data comes by way of the Bureau of Labor Statistics' Quarterly Census of Employment and Wages, and reflects annual averages for 2023.
Caveat: These raw state-by-state figures don't account for varying costs of living between locations.
$126k in Maryland doesn't go as far as it would in, say, West Virginia.
What's next: Multiple lawsuits filed by federal workers in connection with President Trump and Elon Musk's efforts to cull the government workforce are still working their way through the courts.